Here at Niteco, we live and breathe web performance. Not only have our specialists spoken on the topic on numerous occasions, but it’s also one of the things we focus on the most when we build or maintain a project.
Performance makes a difference, in a site’s usability and, ultimately, in your bottom line. Good web performance is the difference between a user being wowed by your site’s extremely quick loading time and them abandoning your site after waiting for it to load for several seconds. And studies have shown many times that users are not forgiving to bad performance. You’re not even given the colloquial three strikes. It’s two seconds and you’re out.
For websites or applications that are already live, Niteco offers its popular 24/7 Proactive Response service for many clients, such as Avensia. As part of this service, a team of specialists distributed across different time zones around the world monitors not only the security and integrity of your application, its integrations and more, but also measures performance.
We asked the experts in the 24/7 Proactive Response team to name the tools that they recommend for use in conducting web performance tests. These are the 3 tools they named.
SpeedCurve

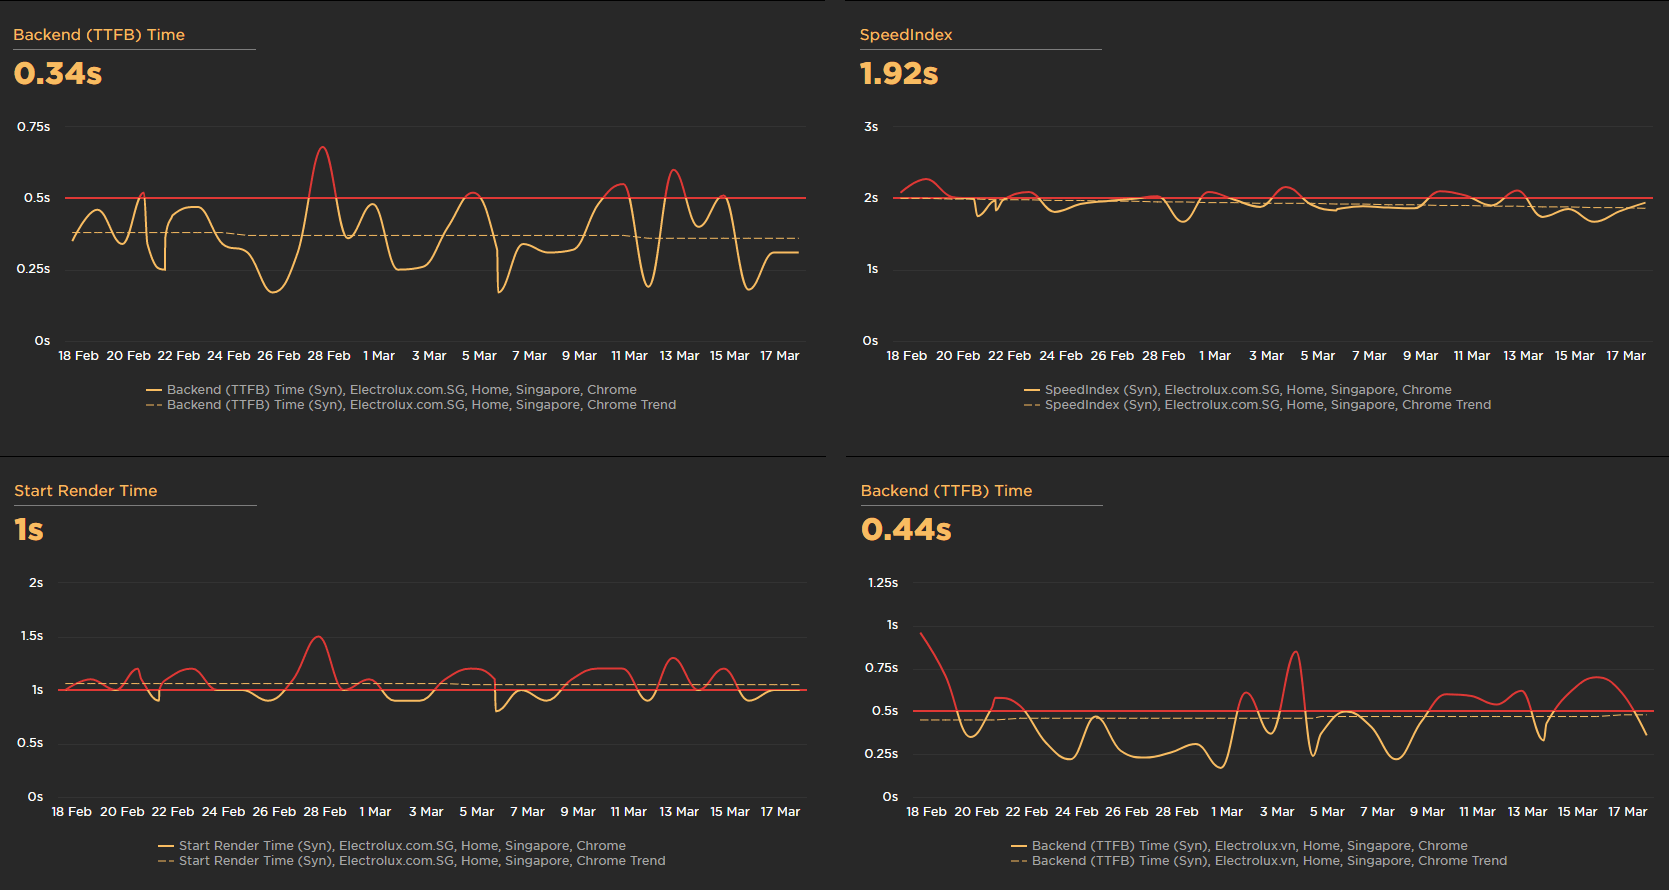
This tool provides insights into the information that is collected over a period of time, which you set yourself. It collects information for both the front-end and back-end on one aspect of the site with each run, e.g Performance scoring, PWA assessment, etc.
Along with the technical results and bare numbers – using which you can compare synthetic and real user monitoring data –, SpeedCurve also provides detailed suggestions for improving the score. For instance, it could make you aware of a file not being in the static cache. Clear information like this will help your development team or development partner to know what to do in order to improve the performance. The team can then even debug web performance issues at the page level.
SpeedCurve also provides you with in-depth insights into the loading process of your site. In a waterfall diagram, it shows exactly which elements are loaded and rendered at what point in the process. This lets you see at once where there is room for improvement and which critical content should perhaps be moved forward in the loading process. To make sure that your site performs well on all devices, you can even simulate its loading process on various screen sizes and mobile devices. This helps you in ensuring that the user experience is the best it can be, however users come to your site.
The tool also allows you to see the performance impact of ads and third-party integrations. If you use the addData function of the LUX API to feed your own customer and conversion data into the tool, SpeedCurve can even show you the impact that web performance has on your business metrics.
To keep a constant eye on how your site’s performance develops, SpeedCurve lets you test continually and create performance budgets so you can receive alerts when certain thresholds are crossed.
Yellow Lab

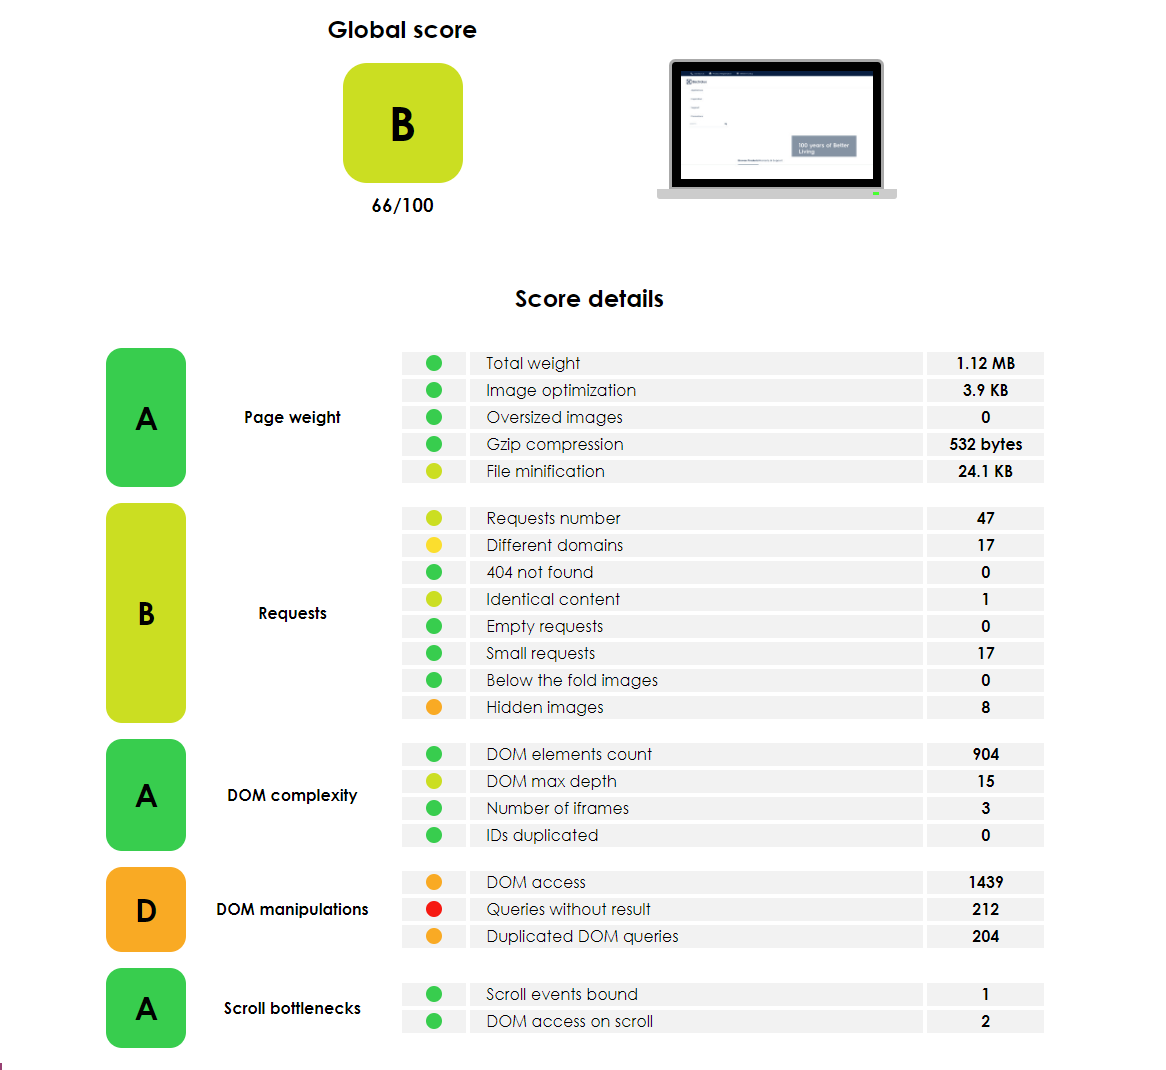
This tool focuses on reviewing front-end code. The reports created by Yellow Lab evaluate page scores on several aspects.
For one, the tool evaluates front-end quality. It highlights quality problems in the HTML, DOM, CSS, Javascript etc. To help you work on web performance, it also checks if performance Best Practices have been applied.
Dareboost

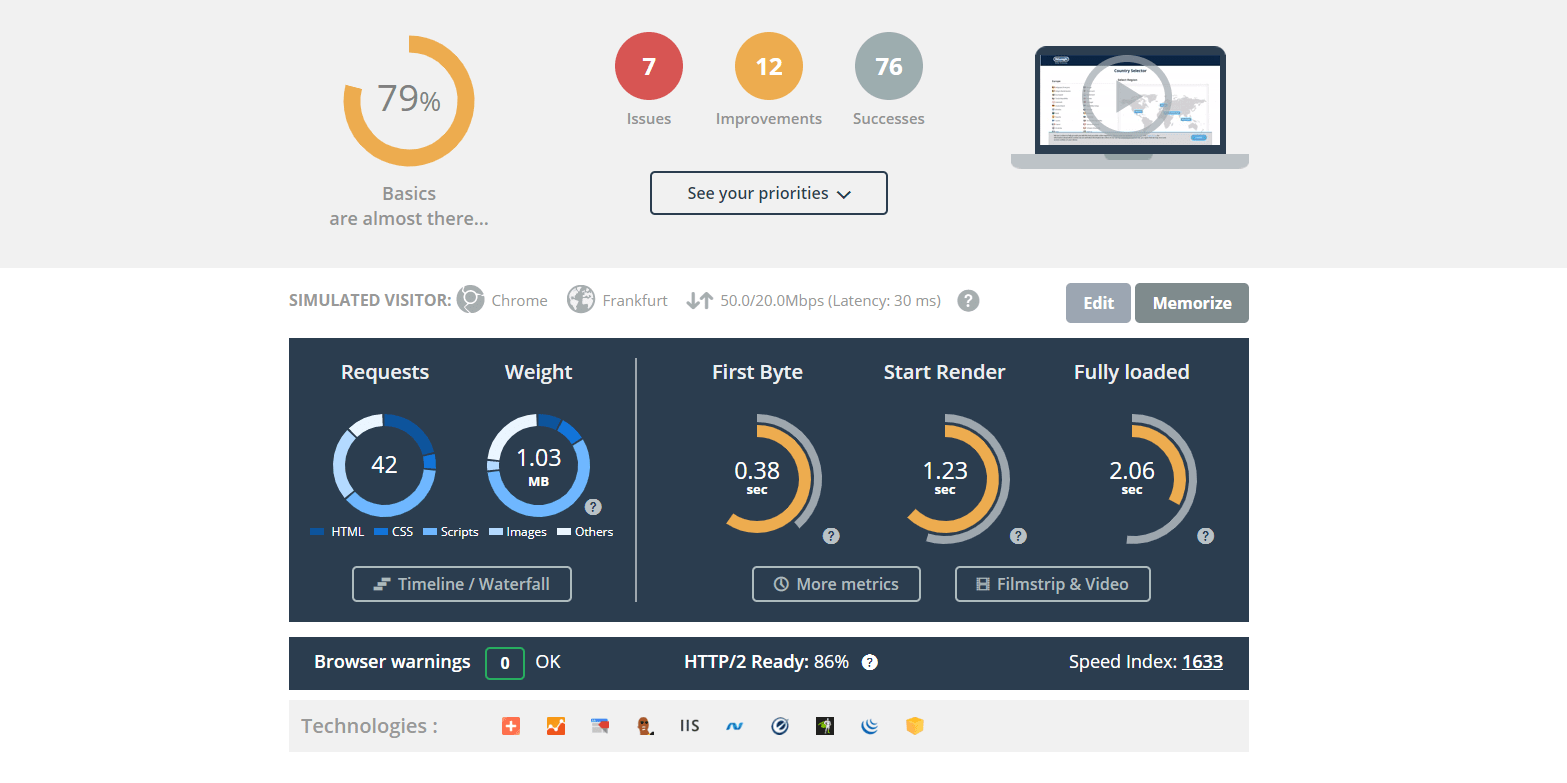
Dareboost provides performance analysis and monitoring only at the time the tool scans the website, not for continuous testing.
It measures your site’s performance in terms of loading speeds and also provides data on its accessibility.
Does your site have performance issues or do you need a team that takes care of your project around the clock? Contact Niteco today to find out how we can help you.
to transform your business and drive results?
